

Key Takeaways
- Macro: Aggregate consumer spending remains resilient, though increasingly hinges on asset appreciation and the corresponding expansion of wealth disparities, as continued inflation pressures and labor market fragility pose mounting downside risks to lower-income households.
- Housing: Structural affordability challenges continue to weigh on housing activity, while the impact of prospective Fed easing may be limited, absent a return of quantitative easing policies targeting the long end of the curve.
- Artificial intelligence: Accelerating AI investment is driving growth expectations while raising doubts about return on invested capital potential and exposing infrastructure, power, and capital limitations.
- Fiscal, trade, and geopolitics: Markets have remained remarkably complacent overall in 2025 toward persistent deficits, tariffs, and geopolitical tensions, though each will undoubtedly drive intermittent volatility throughout 2026.
- Outlook: Entering 2026, stretched valuations, top-decile credit spreads, and extreme equity concentration create a challenging environment for forward return potential as markets remain highly exposed to the singular AI theme, all while geopolitical and policy uncertainty pose mounting volatility risks.
Powell said it best: “There are no risk-free paths now. It’s not incredibly obvious what to do.” 1
The year that inspired such a candid assessment was defined by heightened uncertainty. Investors worked to mitigate growing tariff/trade and fiscal risks while diversifying away from an increasingly crowded U.S. equity market amid mounting concerns over stretched valuations, extreme concentration, and a growing reassessment of both the perils and promises of artificial intelligence. Below, we explore the key trends that shaped markets in 2025, and the trade-offs investors were forced to navigate along the way.
The Big Picture
Through September 2025, aggregate consumer spending has remained surprisingly resilient, lingering above 105% of its multi-decade trend.2 Over the past seven years, rising asset prices have significantly bolstered household balance sheets, with equity appreciation alone adding nearly $30 trillion in liquid wealth since December 2018.3 This surge in net worth has helped support consumption despite sticky inflation and rising interest rates, masking underlying affordability pressures as the economy increasingly depends on asset appreciation to sustain its current growth trajectory.
Beneath the surface, however, this economic resilience is unevenly distributed. Nearly 75% of total wealth accumulation since December 2018 has benefitted the top 20% of American households, while less than 10% of total wealth accumulation accrued to the bottom 40% over this same time frame – roughly half of which derived from illiquid home price appreciation.4 Meanwhile, runaway inflation, deteriorating job opportunities, and stubbornly high 10-year yields – which dictate mortgage and credit card financing rates – eroded the purchasing power of lower-income households and drove substantial increases in consumer credit delinquency rates. This consumer bifurcation could wear on aggregate consumer demand in 2026, as top-quintile households continue to accumulate wealth courtesy of stimulative monetary policy, while persistent inflation and labor market weakness weigh on discretionary spending in lower-income households.
Macroeconomic dependence upon monetary stimulus in the form of asset inflation is not without risk. As an illustrative example, a sustained 20% loss on $50 trillion of household equity holdings would wipe out $10 trillion of household wealth. Assuming just 2.5%-3.0% of those losses resulted in foregone spending, aggregate consumption would decline $250-$300 billion – a ~1% hit to total GDP.
That said, for as long as rising asset prices sustain resilient consumption, inflation will remain a key risk to monitor. Inflation swaps imply some price moderation in 2026 on cooling services prices, despite reaccelerating inflationary pressures in heavily imported goods categories. U.S. consumers should continue to absorb lingering tariff pass-throughs, while excess Chinese manufacturing capacity finds a new home outside U.S. markets, resulting in a divergence in global inflation trends as other global economies absorb deflationary pressures.
An increasingly fragile U.S. labor market compounds these challenges. Lower immigration, increased deportations, productivity gains, and operational restructuring efforts implemented to offset tariff-related cost increases, are just some of the factors contributing to a softening labor market. Deteriorating reporting quality from the Bureau of Labor Statistics has only served to mask the true extent of labor market deterioration, with the last two initial annual benchmark revisions erasing a combined 1.7 million jobs, or roughly 45% of all the jobs previously thought to have been created over this time period.
Private payroll measures have corroborated recent labor market softening, with the latest ADP print driving the trailing 3-month average job gain to the lowest level (excluding the pandemic) since November 2019, while rising Challenger job cut announcements imply further weakness may be lurking around the corner.
Together, above-target inflation and a cooling labor market introduce significant uncertainty into the Fed’s rate path. While the Fed’s policy bias has thus far tilted in favor of the labor side of the dual mandate, prompting 3 cuts in 2025, mounting stagflation risks have the potential to embolden the more hawkish members of the FOMC.
Inflation Expectations
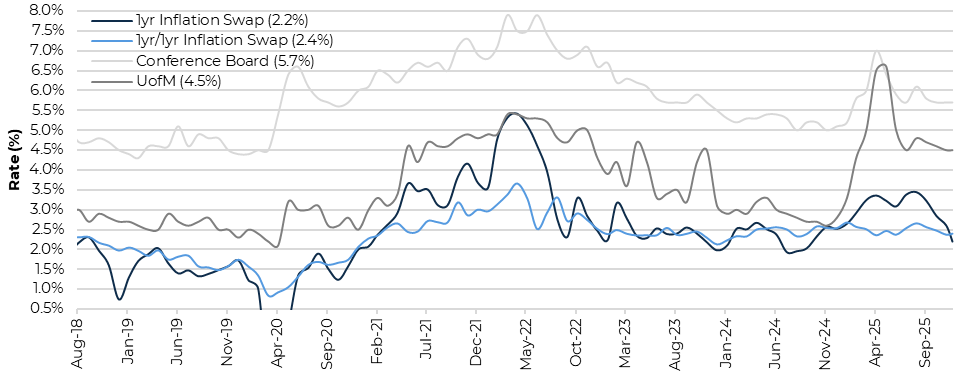
Source: Bloomberg Finance, L.P. as of 12/18/25. University of Michigan as of 12/19/25. The Conference Board as of 11/25/25.
Nonfarm Payroll Additions and Breakevens
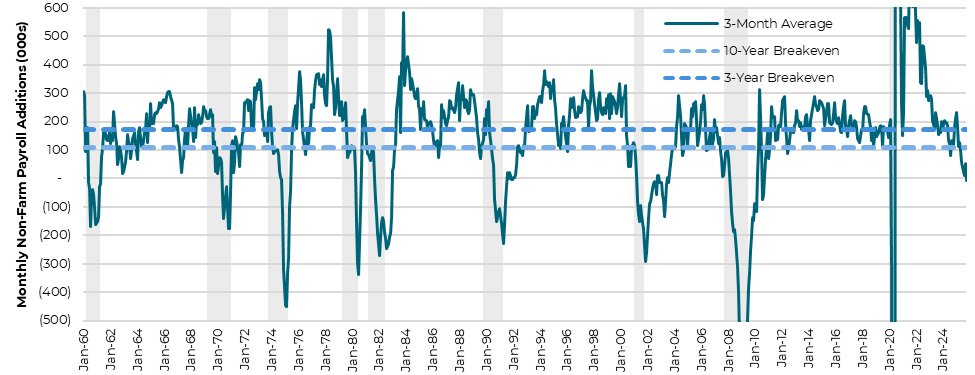
Source: U.S. Bureau of Labor Statistics as of 12/16/25. Breakeven levels defined as the average monthly change in Civilian Labor Force over the relevant period multiplied by the current employment rate. Shaded areas indicate recessions.
90+ Day Delinquency by Loan Type
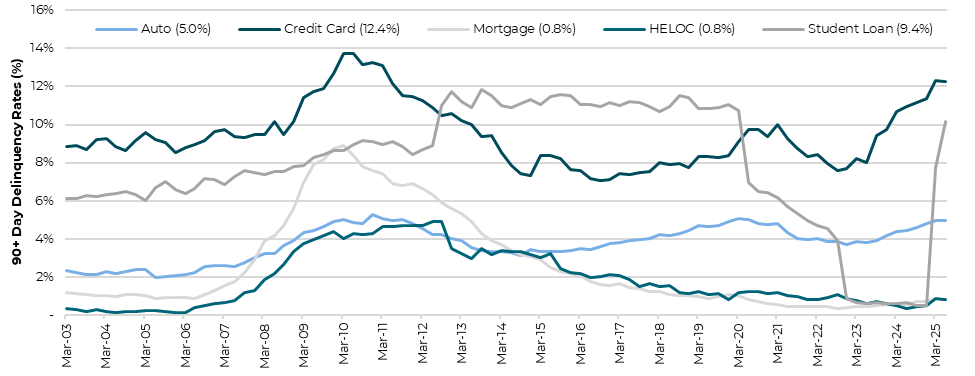
Source: Federal Reserve Bank of New York as of 11/5/25.
Key Takeaways by Category
Housing’s Structural Stall
The housing market remains a clear vulnerability in an otherwise resilient macroeconomy. Record unaffordability has trapped homeowners in 3% to 4% post-pandemic mortgages, keeping existing home sales near their lowest per-capita level since the financial crisis. New home sales have held up better in comparison on significant price cuts and homebuilder incentives that now exceed 10% of selling price for some builders. In real terms, however, new home prices (excluding incentives) are about 15% below their October 2022 peak and back to April 2016 levels. New home inventory has hovered near 500,000 units since January 2025 – the highest since November 2007 – while hopes that Fed rate cuts will materially ease affordability risk are being dashed by higher-for-longer 10-year Treasury yields.5,6,7
Existing Home Sales
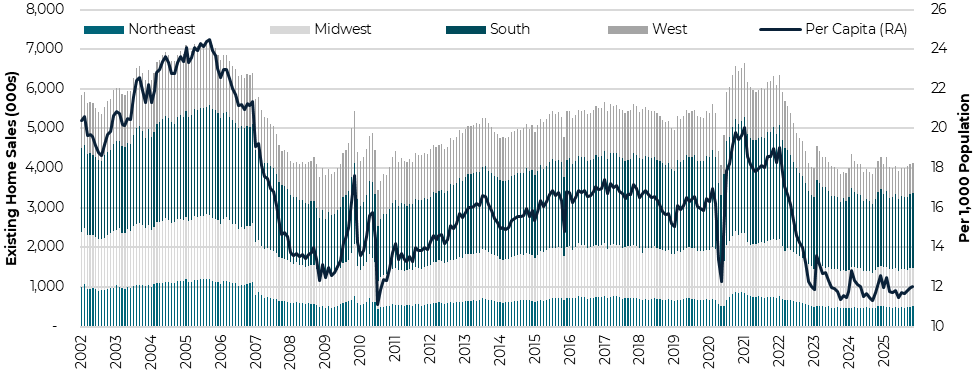
Source: National Association of Realtors as of 12/19/25.
New Home Inventory
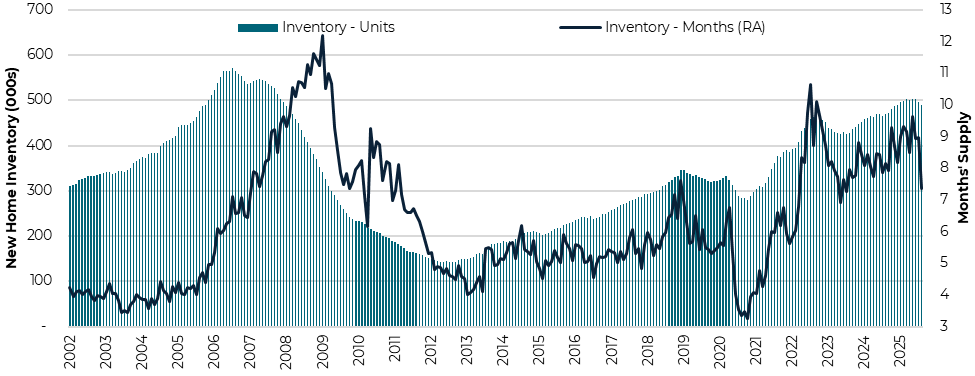
Source: U.S. Census Bureau as of 9/24/25.
Prevailing 30yr Mortgage Rates vs. Effective Rate on Outstanding Mortgages
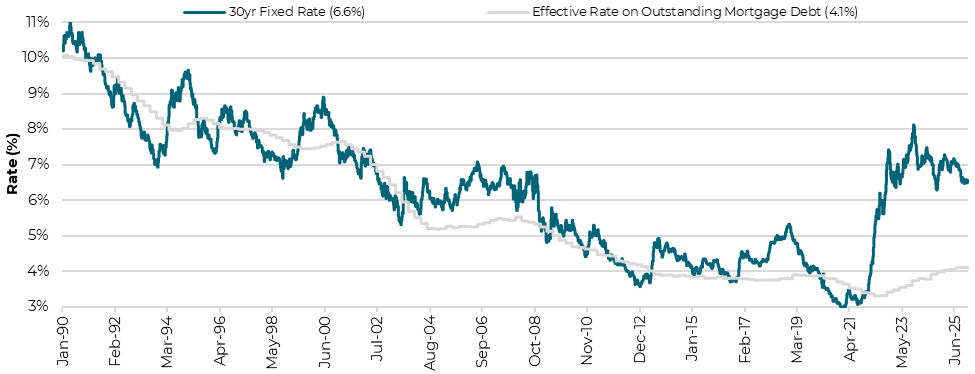
Source: Bloomberg Finance, L.P. as of 6/30/25. Mortgage Bankers Association as of 12/12/25.
Powering the Artificial Intelligence Boom
As AI firms pursue aggressive datacenter buildouts, incremental datacenter demand of 40 gigawatts is expected to come online to the U.S. grid through 2030, at a cumulative estimated cost of $1.5 trillion.8 Power providers are gearing up for this unprecedented surge in energy demand with 120 gigawatts of planned power capacity additions over the same period.9 Still, substantial bottlenecks exist in sourcing necessary power infrastructure, which may limit the timely realization of many projects, casting doubt over the U.S.’s ability to meet the full quantum of expected demand.
Concerns are also mounting that AI firms will fail to clear return hurdles sufficient enough to justify their eye-watering datacenter buildout costs. Indeed, $1.5 trillion of datacenter spending through 2030 would require nearly $500 billion of incremental annual EBITDA generation, assuming no cannibalization of existing profitability streams, just to clear a 15% ROIC target – a staggering sum nearly equal to the existing EBITDA of the top 5 hyperscalers in the U.S.
While the path to powering the AI buildout is rife with uncertainty, one thing is clear: consumers will continue to bear the brunt of surging electricity prices, which have already risen by over 40% since January 2019.10
U.S. Datacenter Buildout
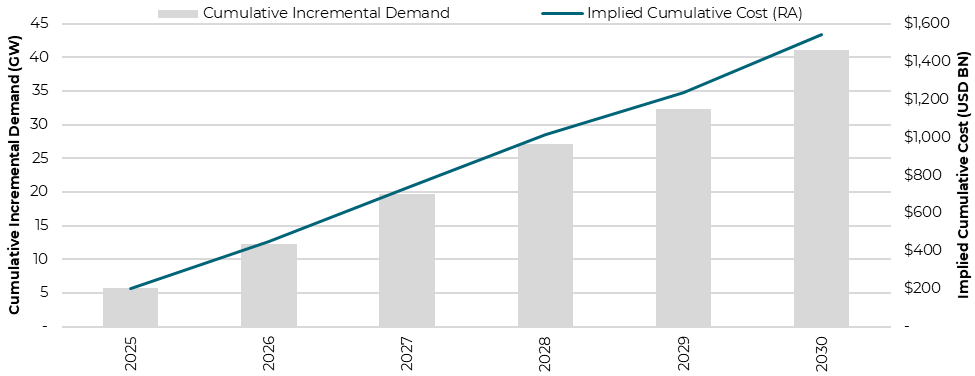
Source: BloombergNEF analyses as of 5/5/25 and 11/5/25. J.P. Morgan as of 12/12/25.
U.S. Planned Power Capacity Additions
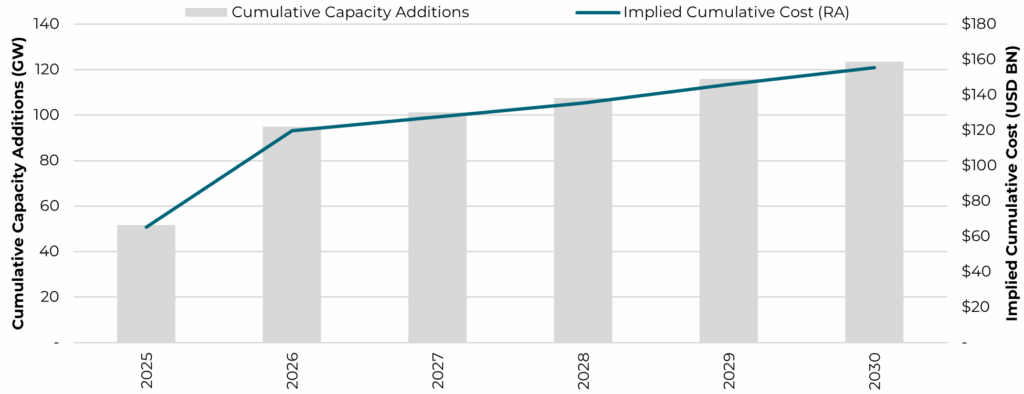
Source: U.S. Energy Information Administration as of 4/15/25 and 7/25/25.
The Politics of Debt, the Reality of Markets
The passage of the One Big Beautiful Bill Act (OBBBA) reaffirms that the era of structurally elevated deficits is here to stay. More than $11.6 trillion in fiscal stimulus has been injected into the U.S. economy since 2020, and the new legislation adds another $3.4 trillion in deficit spending over the next decade.11 As a result, budget deficits are likely to remain in the 6%-7% of GDP range. Efforts to rein in spending through Department of Government Efficiency (DOGE)-related cost cuts or offset deficits with tariff revenue have so far made little difference, with shortfalls still running roughly in line with 2024 levels. A Supreme Court decision striking down International Emergency Economic Powers Act (IEEPA)-based tariffs would only intensify these fiscal concerns and potentially add further upward pressure to Treasury yields.
2025 has already revealed signs of stress lurking beneath the surface of the Treasury market. The first cracks appeared in April, when tariff announcements triggered a disorderly unwind of highly levered Treasury basis trades. More recently, pressure surfaced in overnight funding markets as roughly $2 trillion in Treasury issuance over just five months, following the increase in the debt ceiling, absorbed excess liquidity and pushed bank reserves below $3 trillion – into “ample” territory – for the first time since the pandemic, prompting the Fed to launch $40 billion of “Reserve Management Purchases” per month.12,13
Looking ahead, the 2026 midterm elections are increasingly likely to reintroduce political gridlock in Washington, with Democrats favored to regain control of the House amid historically slim Republican majorities. All 435 House seats, and one-third of the Senate, will be contested. History suggests the President’s party is likely to lose ground, having lost House seats in 20 of the past 23 midterms, with an average decline of 27 seats.14
Fiscal Impact of the OBBBA
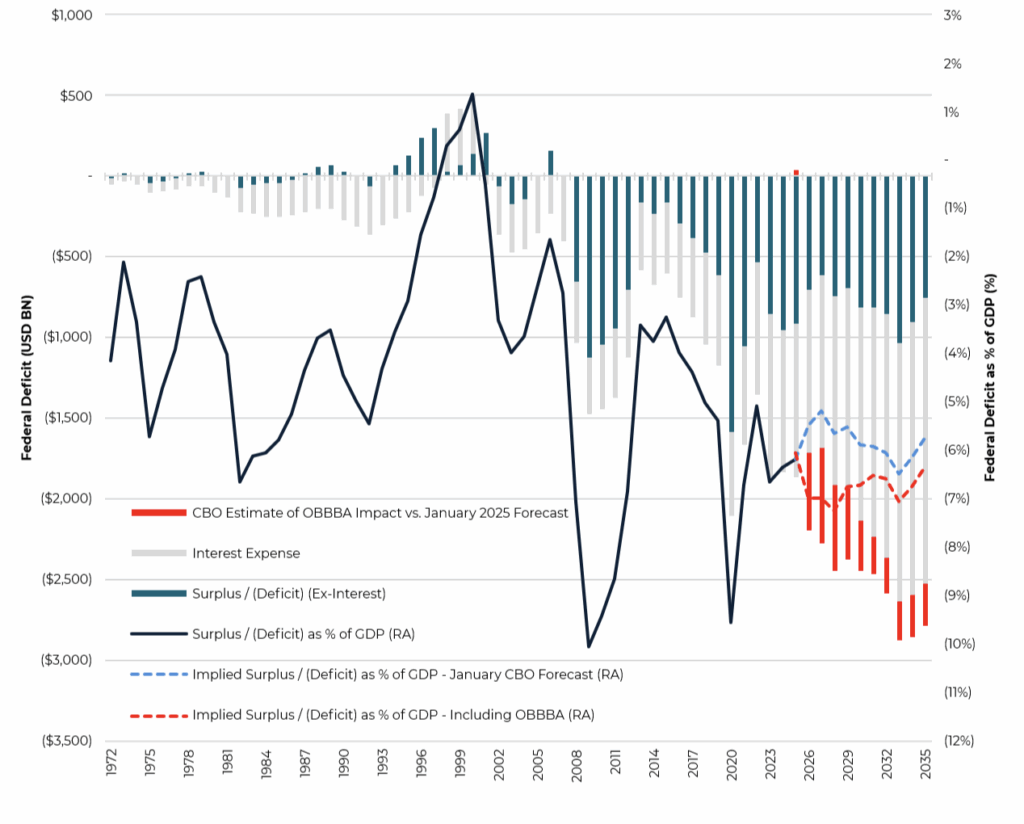
Source: U.S. Bureau of Economic Analysis, Congressional Budget Office as of 7/21/25.
Fed Reverse Repo vs. SOFR – Fed Funds

Source: Federal Reserve Bank of St. Louis and Office of Financial Research as of 12/18/25.
Cuts Without Relief
Fed funds futures are currently pricing in two additional rate cuts in 2026, which would bring the policy rate to roughly 3.00-3.25%.15 At the same time, asset markets appear to be discounting a world in which peak valuations, strong earnings and GDP growth, moderating inflation, and meaningful rate cuts can all coexist – though these events seem far more likely to be mutually exclusive outcomes over the longer term. Indeed, the longer end of the Treasury curve is already starting to reflect the risk that overly dovish rate policy in 2026 – under the direction of a newly appointed Fed chair from the Trump administration – could backfire with excessively stimulative monetary policy reigniting inflation and further stressing lower-income households. Recent experience reinforces this concern: the Fed’s so-called “insurance cuts” in 2025 have largely served to push financial markets to new highs, intensifying inflation risks via the wealth effect, while offering limited relief to lower-income households in the form of stronger payroll growth or meaningfully lower borrowing costs.
Fed Funds Futures vs. Fed Funds Rate
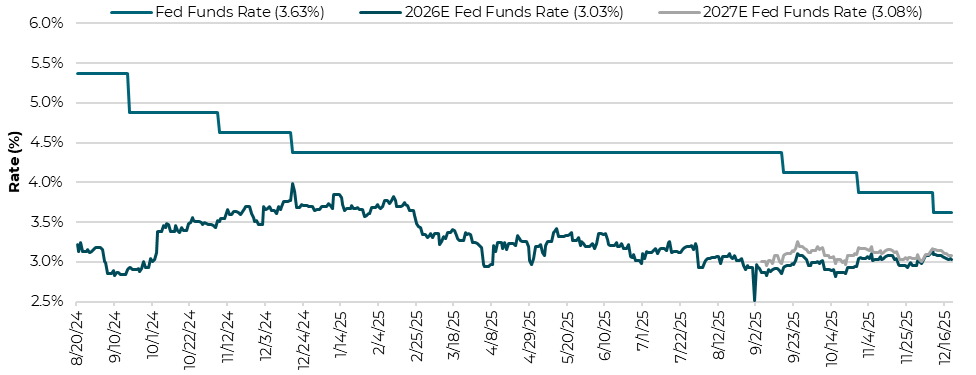
Source: Bloomberg Finance, L.P. as of 12/18/25.
Odds of Next Fed Chair
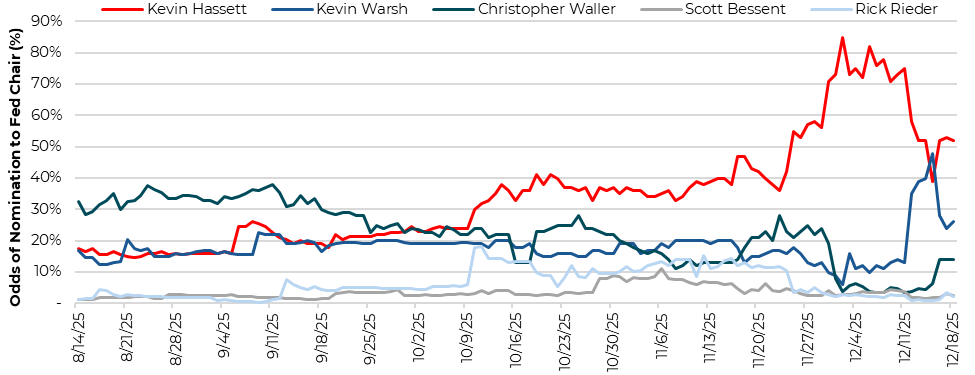
Source: Polymarket as of 12/18/25.
Trade Wars and Kinetic Wars Mostly Ignored By Complacent Markets But Risks Remain
2025 began with a sharp escalation in protectionist trade policy, pushing the effective U.S. tariff rate from nearly 3% at the end of 2024 to a peak of 26% in the immediate aftermath of Liberation Day, driven largely by renewed tensions with China. While global economies absorbed the initial shock better than expected, and the effective U.S. tariff rate has settled to 15%, protectionist measures will continue to threaten U.S. demand for foreign goods.16
Tariffs have generated a roughly $200 billion windfall for the U.S. Treasury in its latest fiscal year, but just over half were collected under IEEPA-based authorities now being challenged in the Supreme Court. While the SCOTUS case raises the possibility of tariff refunds, the ultimate quantum will likely end up below the $110 billion (and growing) at risk due to uncertainties and complexities surrounding the to-be-determined refund process.17 Even if struck down, the administration is likely to leverage other trade remedies to keep the overall tariff rate near current levels.
Looking ahead to 2026, tariff policy will likely hinge on rolling China and Mexico trade deadlines, the mid-2026 United States-Mexico-Canada Agreement (USMCA) review – particularly for autos – and a SCOTUS ruling potentially invalidating IEEPA-based tariffs, likely prompting new sector- and/or country-specific tariffs which further disrupt global supply-chains. Evidence suggests corporations have largely absorbed tariff costs to date and are still passing them through to consumers – an outcome that would keep inflation firm and further diminish the real purchasing power of lower- and middle-income households.
Meanwhile, markets have remained remarkably complacent to growing geopolitical risks around the world, ranging from the wars in Ukraine and Gaza, intermittent conflicts in the Middle East and Asia, and U.S. interventions in South America. Oil markets have been the key exception to this relative calm, exacerbated by global governments’ hyper-vigilance over supply-chain risks and the knock-on effects of sustained oil price increases to already elevated inflation at home. Going forward, as several major conflicts remain unresolved heading into 2026 and still others emerge, broader markets may be forced to pay attention.
Effective U.S. Tariff Rate
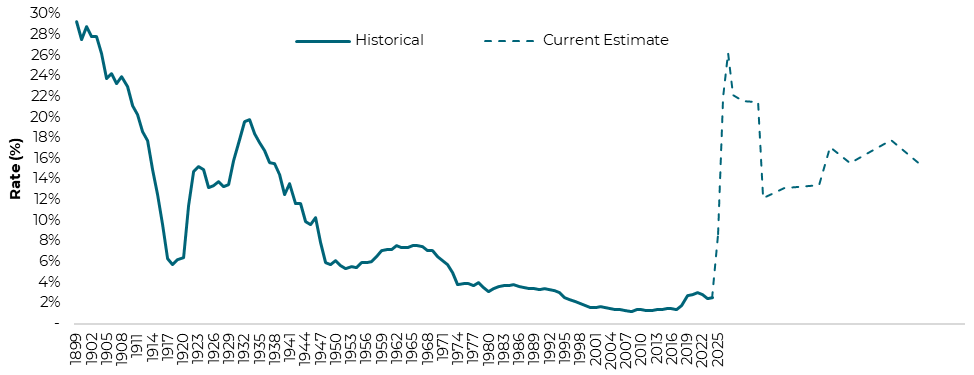
Source: Historical rate per Tax Foundation as of 12/18/25. Current estimate per J.P. Morgan as of 11/21/25.
Treasury Net Customs Receipts
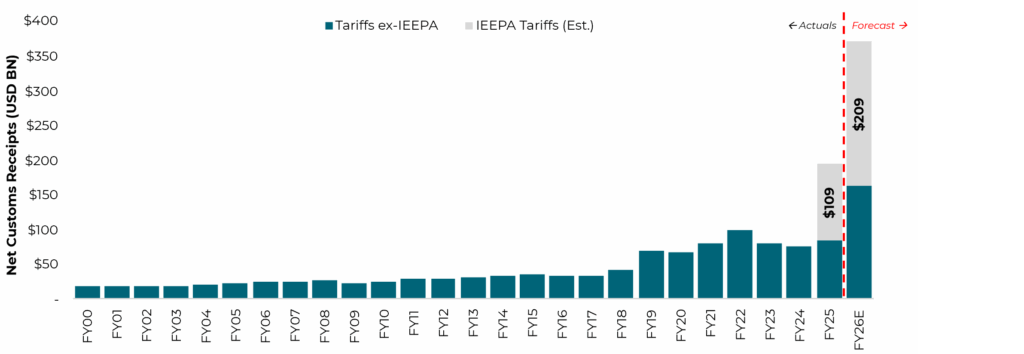
Source: U.S. Treasury as of 12/10/25. U.S. Customs and Border Protection as of 9/23/25. Forecast reflects FY26 YTD annualized per U.S. Treasury data as of 12/10/25.
Geopolitical Risk Index
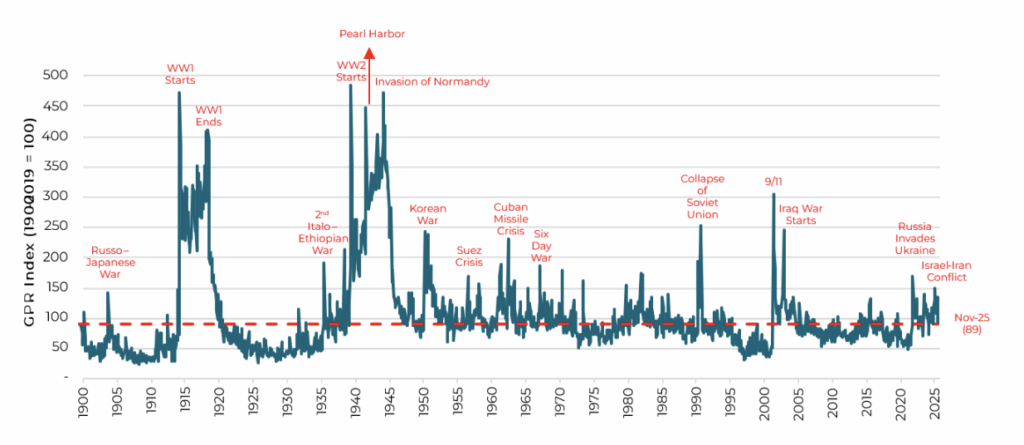
Source: Caldara and Iacoviello Geopolitical Risk Index as of 12/18/25.
Equities at Peak Valuations
Turbulence in equity markets – first emerging at the beginning of the year on DeepSeek fears and concerns over waning “U.S. exceptionalism” – came to a head after Liberation Day sparked a ~20% selloff in the S&P 500 from the February highs, and the erasure of more than $10 trillion in total U.S. equity value, at the height of the selloff.18 The market ultimately reversed course only after stress began to surface in the Treasury market, prompting trade concessions from the Trump administration and reigniting a risk-on rally that pushed valuations back toward all-time highs.
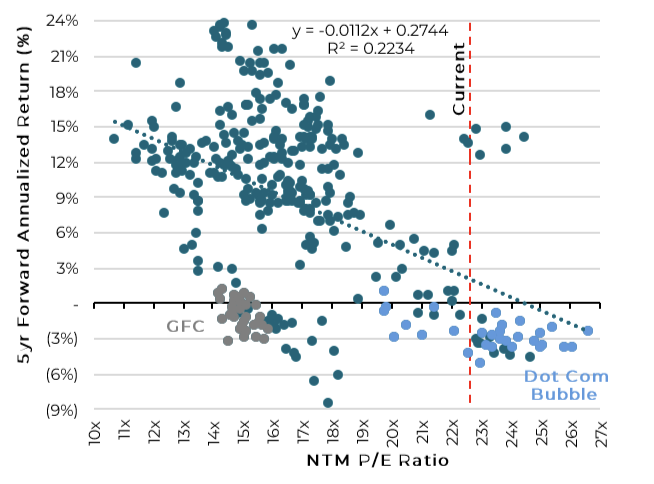
History offers a sobering backdrop for markets priced at current levels. Peak valuations have historically been correlated with weaker forward returns, as long-term relationships between starting multiples and outcomes suggest little – if any – equity upside over the next five years.
At the same time, extreme concentration has made markets more fragile, with the top 10 stocks now accounting for 40% of the S&P 500, one of the highest levels in history.19 This level of concentration increases the risk that company-specific developments beget broader market volatility that ultimately spills over into the real economy. For now, continued equity outperformance remains tightly tethered to the AI narrative, with the “Magnificent Seven” expected to drive a third of total S&P 500 earnings growth in 2026.20
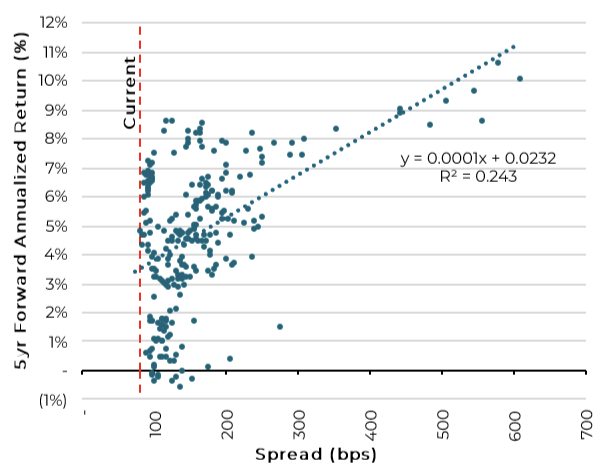
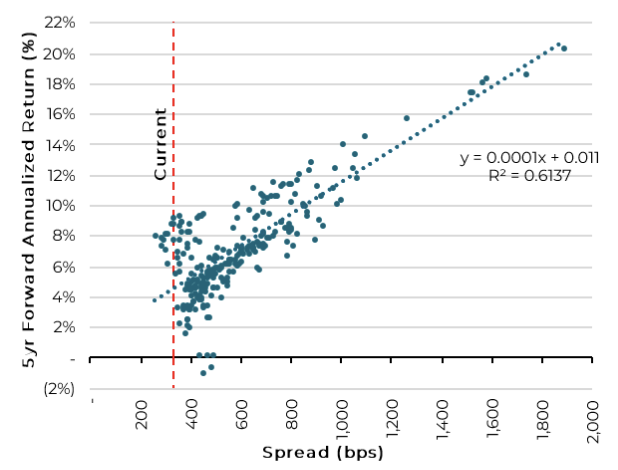
5yr Forward Annualized Return Potential
S&P 500
Investment Grade
High Yield Bonds
Leveraged Loan
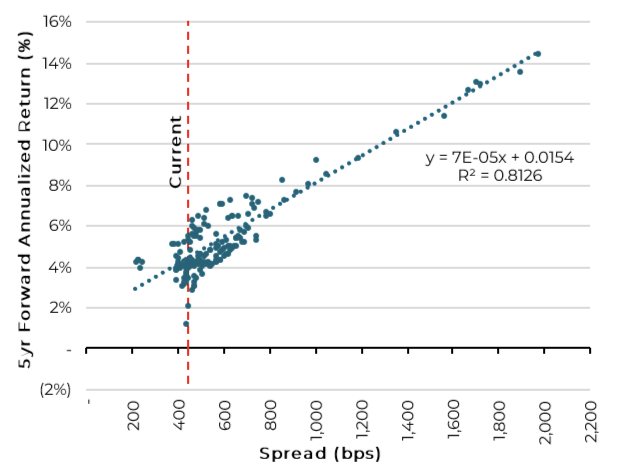
Source: Bloomberg Finance, L.P., J.P. Morgan as of 12/18/25. Data on a monthly basis. Equities data from 1990-present. Investment Grade and High Yield Bond data from 1999-present. Leveraged Loan data from 2007-present.
Low Spreads Require High Selectivity
Credit markets experienced bouts of volatility in 2025, with Liberation Day briefly driving sharp dislocation as high yield bond and leveraged loan spreads widened roughly 175 and 125 basis points from their January tights, respectively, before promptly retracing much of this move wider.21 With spreads now back at or near historic tights, the scope for further price appreciation in 2026 remains limited, even as elevated all-in yields still offer a reasonably attractive backdrop for total returns. That dynamic puts a premium on careful credit selection, as investors receive shrinking compensation for incremental idiosyncratic risk. Looking ahead, the ~$1.2 trillion high yield bond and leveraged loan maturity wall from 2028 to 2029 looms as a potential default and liability management catalyst, particularly among higher-beta credits unable to roll, while also pressuring earnings for fixed-rate issuers refinancing at higher rates.22
Recent stress has put a spotlight on quality dispersion across the credit spectrum. High yield bonds continue to outperform leveraged loans on superior overall credit quality, with B3 or lower maturities through 2028 accounting for 29% of the high yield market, compared to 52% of the leveraged loan market.23 While high yield bond distress and default rates remain within long-term medians – despite a recent uptick – leveraged loans tell a more concerning story. Leveraged loan distress levels are within historical norms, but defaults (including distressed exchanges) surged in 2025 to their highest level (excluding the pandemic) since 2010, driven by aggressive and increasingly hostile liability management exercises that have also weighed on recovery rates.24 After several high-profile credit implosions this year, underwriting standards have tightened modestly, suggesting that lower-quality issuers are less likely to benefit from indiscriminate refinancing demand going forward.
LTM Default Rates
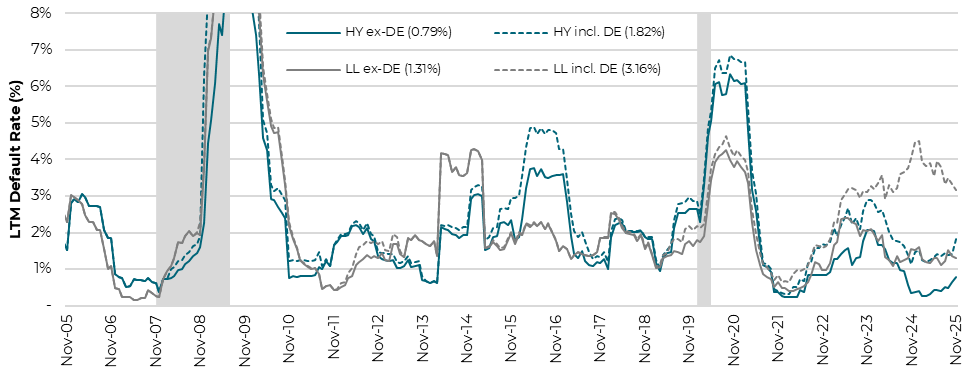
Source: J.P. Morgan as of 12/1/25. DE: distressed exchange. Shaded areas indicate recession.
Recovery Rates
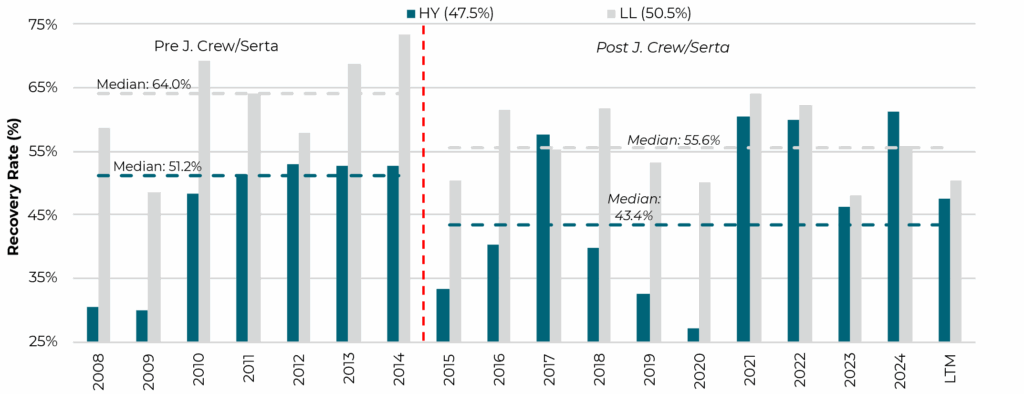
Source: J.P. Morgan as of 12/8/25. Recovery rates include distressed exchanges.
The Year Ahead
Looking into 2026, consumer bifurcation will continue to place pressure on both sides of the Fed’s dual mandate. For as long as the equity rally continues, top-quintile American households will continue to reap the benefits of wealth accumulation, while the bottom half of households battles a softening labor market, shrinking disposable income, and surging delinquency rates.
Against that backdrop, artificial intelligence remains central to market direction; however, the bar set by early optimism is becoming increasingly harder to clear. Hyperscalers are already turning to debt markets to help fund mounting capital needs as cash burn rises. Roughly $1.5 trillion in AI-related spending through 2030 would require nearly $1.3 trillion in annual incremental revenue (without cannibalizing existing business lines) – equivalent to just over $9,000 per U.S. household – simply to earn a 15% return on invested capital over the next five years.25
As 2026 unfolds, stretched valuations and extreme concentration leave markets increasingly susceptible to periods of amplified volatility as micro developments at a handful of companies can meaningfully move broader indices and drive macro risk. Should this occur, market complacency in the face of ever-mounting trade, geopolitical, and fiscal risks may finally unwind, exposing turbulent currents lurking just below the calm surface and placing a heightened premium on vigilant stewardship of financial assets.
Disclaimer regarding use of J.P. Morgan Indices: Information has been obtained from sources believed to be reliable, but J.P. Morgan does not warrant its completeness or accuracy. The Index is used with permission. The Index may not be copied, used, or distributed without J.P. Morgan’s prior written approval. Copyright 2025, JPMorgan Chase & Co. All rights reserved.
This material does not constitute investment advice or a recommendation, or an offer to sell or a solicitation to deal in, any security or financial product. The material is provided for informational purposes only and recipients should not rely on it in making any investment decisions. Certain information in the material has been obtained from third party sources, and such information has not been independently verified by Aquarian. No representation, warranty, or undertaking, express or implied, is given to the accuracy or completeness of such information by Aquarian or any other person. While such sources are believed to be reliable, Aquarian does not assume any responsibility for the accuracy or completeness of such information. Except where otherwise indicated, information is based on matters as they exist as of the date of preparation and not as of the date of distribution or any future date. Aquarian does not undertake to update the information as of any future date. The material contains forward-looking statements, identified by terms such as “may,” “will,” “should,” “expect,” “anticipate,” “project,” “estimate,” “intend,” or similar expressions. Actual results may differ materially due to risks and uncertainties. These statements are not guarantees of future performance and should not be relied upon as such. There are no assurances forecasts or objectives will be achieved, and actual results may differ significantly due to factors such as market conditions and economic trends.
References
- Source: Federal Open Market Committee (FOMC) Press Conference on 9/17/25.
- Source: U.S. Bureau of Economic Analysis as of 12/5/25.
- Source: Federal Reserve as of 9/19/25.
- Source: Federal Reserve as of 9/19/25.
- Source: National Association of Realtors as of 12/19/25.
- Source: U.S. Census Bureau as of 9/24/25.
- Source: Public homebuilder filings as of 10/3/25.
- Source: BloombergNEF analyses as of 5/5/25 and 11/5/25. J.P. Morgan as of 12/12/25.
- Source: U.S. Energy Information Administration as of 4/15/25 and 7/15/25.
- Source: U.S. Energy Information Administration as of 12/9/25.
- Source: U.S. Bureau of Economic Analysis, Congressional Budget Office as of 7/21/25.
- Source: Federal Reserve as of 12/18/25.
- Source: Federal Reserve Bank of New York as of 12/10/25.
- Source: The American Presidency Project, UC Santa Barbara as of 12/6/22.
- Source: Bloomberg Finance, L.P. as of 12/18/25.
- Source: J.P. Morgan as of 11/21/25.
- Source: U.S. Treasury as of 12/10/25. U.S. Customs and Border Protection as of 9/23/25.
- Source: Bloomberg Finance, L.P.
- Source: Bloomberg Finance, L.P. as of 12/18/25.
- Source: Bloomberg Finance, L.P. as of 12/18/25.
- Source: J.P. Morgan.
- Source: J.P. Morgan as of 11/17/25.
- Source: J.P. Morgan as of 11/27/25.
- Source: J.P. Morgan as of 12/1/25.
- Source: BloombergNEF analyses as of 5/5/25 and 11/5/25. J.P. Morgan as of 12/12/25. U.S. Census Bureau as of 12/2/25.